Monthly Climate Analysis
Rainfall (1981-2021) and temperature (1961-2021) time series reconstructed from station observations and remote sensing proxies. This interface allows users to view rainfall, maximum and minimum temperature climatologies and anomalies.
Dataset Documentation
The International Research Institute for Climate and Society (IRI) and partners have been leading an effort to simultaneously improve the availability, access and use of climate information at the national level in African countries. This effort, named “Enhancing National Climate Services (ENACTS)”, has already been implemented in a number of countries in Africa. The foundation of ENACTS is the creation of quality-controlled, spatially and temporally complete climate data set. This involves organization and quality control of station data, and generating historical time series by combining station observations with satellite and other proxies. This approach has been implemented by Meteo Rwanda to generate over 30 years (1981 to present) of rainfall and over 50 years (1961 to present) temperature time series at dekadal (10-daily) time scale and for every 5km grid point across Rwanda. This document provides a brief description of how these datasets were created along with the quality of the generated data.
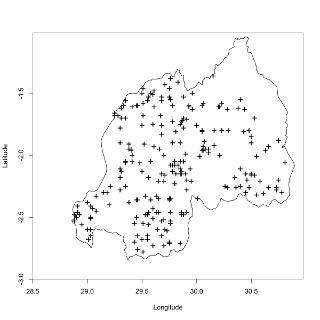
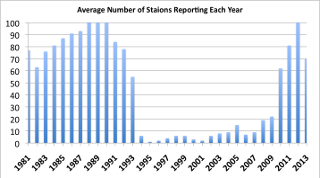
1. Availability and quality of station data Figure 1 presents the location of stations that measure rainfall. A small number of these stations (~25) also measure temperatures. Some of the stations may not be reporting all the time. Figure 2 show the number of stations that reported rainfall each year between 1981 and 2016. This figure show that missing observations is a very serious challenge for Rwanda, owed to the devastating 1994 genocide and the long time it took the national meteorological agency to recover its capacity.
2. Quality control of station data Data quality control is a critical component of ENACTS. A significant amount of time is spent on this aspect of the work. Data quality control involves checking station coordinates, identifying outliers as well as checking for the homogeneity of the time series for each station. The numbers of outliers found were relatively small. The homogeneity test revealed some serious problems, particularly with temperature data. These erroneous measurements were either fixed or removed.
3. Reconstructing historical time series Rainfall In the standard ENACTS approach, historical rainfall time series are generated by combining station observations with satellite estimates for each dekad (ten day period) of each year. However, this approach does not work for Rwanda because of the 15-year gap in observations. Thus, a different approach was needed for Rwanda. The approach adopted removes the mean (climatological) differences (bias) between the satellite rainfall estimate and station data. The mean bias is computed using data between 1981 and 1993. The satellite product used is CHIRP from University of California, Santa Barbara. The generated data are used for the Climate Analysis Maproom. Standard merging is also done for the years when station data is available. The time series generated with this approach is not uniform and is used only for the Climate Monitoring Maproom.
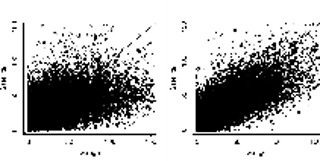
The simple adjustment (bias removal) of the satellite estimate results in significant improvement (Figure 3). The comparison in Fig.3 is done for point values and part of the scatter comes from inaccurate station locations as well as some errors in station measurements.
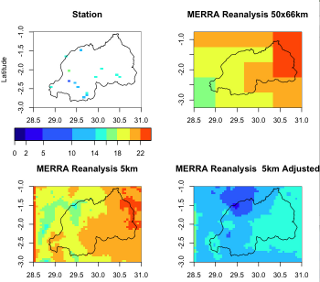
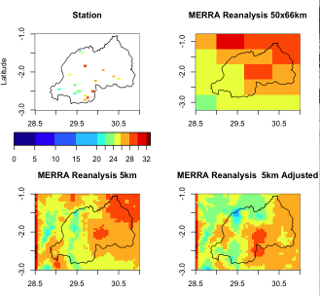
For temperature, the Japanese 55-year Reanalysis (JRA55) was used as a proxy. The reanalysis data were first downscaled from 50km to 5km. Then a similar approach to that of rainfall is used to remove climatological bias between station measurements and the reanalysis product. Figure 4 compares three different reanalysis maps with that of the station measurements for minimum and maximum temperature. The downscaled reanalysis has a more realistic spatial distribution of temperature compared to the first map. However, both reanalysis products significantly overestimate minimum temperature compared to the station measurements (top left). In the case of maximum temperature, the reanalysis products, both downscaled and original resolution, are close to the station measurements. The corrected products are very close to station values. The correction factors were developed using data from 1981 to 1993, but the result shown are for a specific dekad of a specific year.
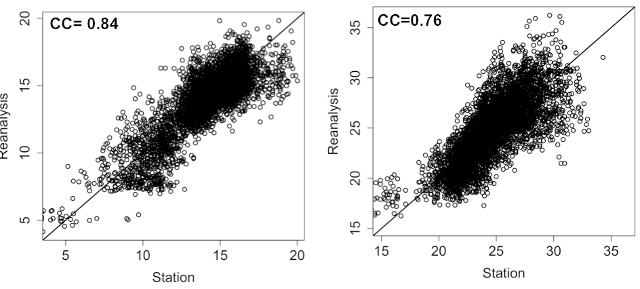
The scatter plots in Figure 5 also show a very good agreement between the station measurements and corrected reanalysis data. Station measurement and location uncertainties significantly contribute to scatters in this figure. This means that the actual quality the data could be better than what is shown in the scatter plots.
How to use this interactive map
Helpdesk
Contacternestbagambiki@gmail.com with any technical questions or problems with this Map Room.